


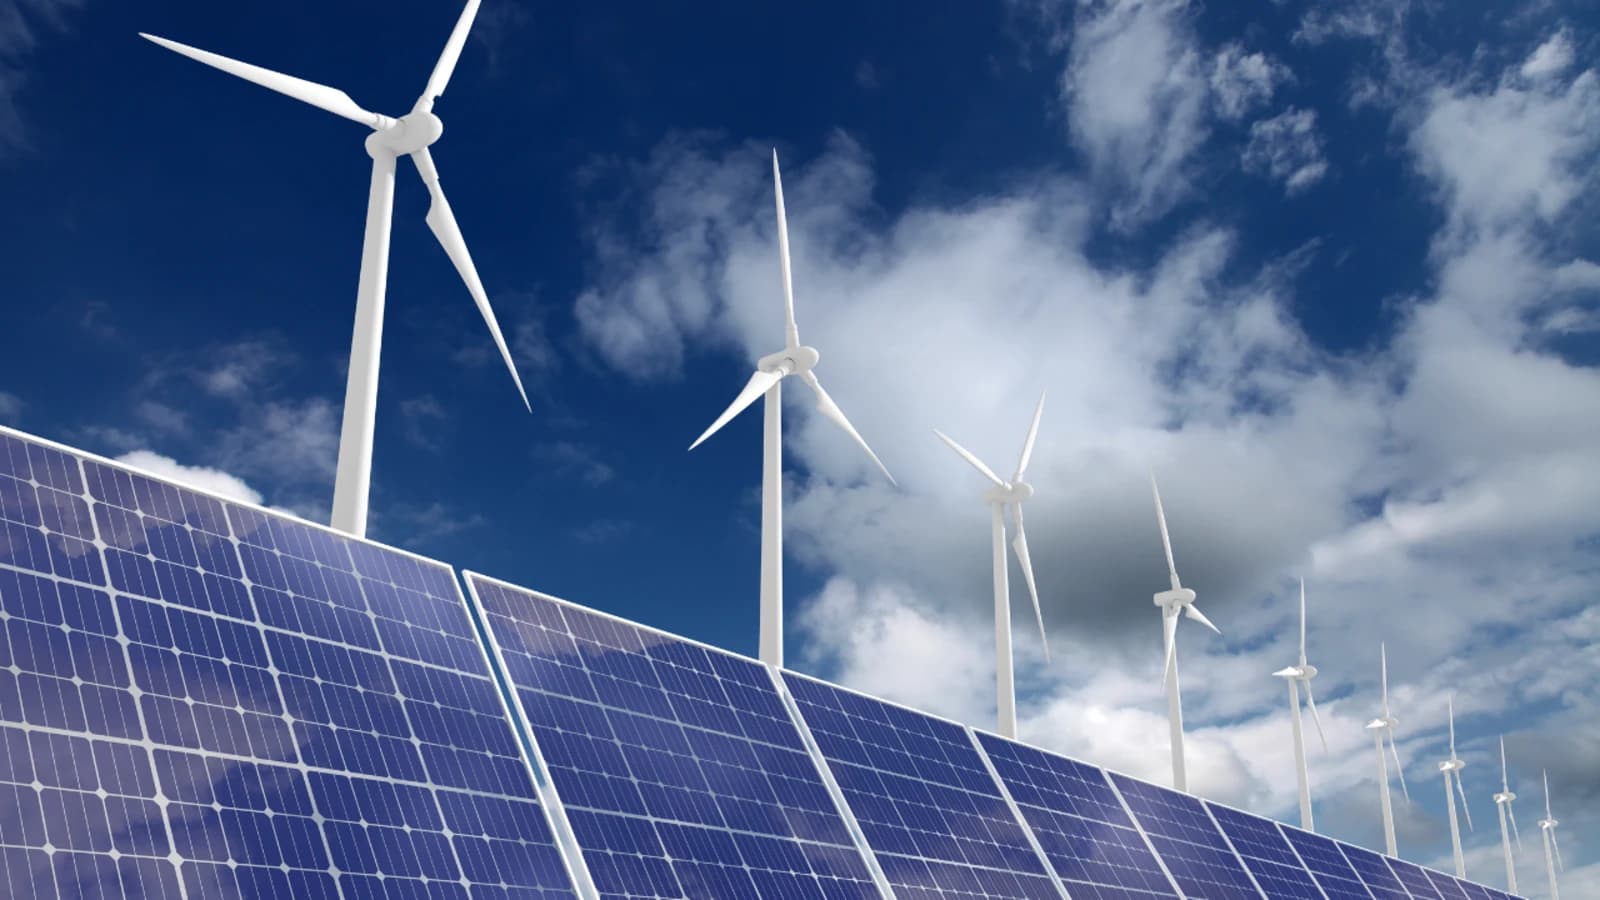
Global installed solar capacity surpassed 3,000 GW for the first time in April 2026. Data from Ember placed photovoltaic power at 3,025.26 GW , more than double the 1,331.04 GW of wind power recorded during the same month.
Together, both technologies reached 4356.30 GW , of which solar accounted for approximately 69.4% and wind for the remaining 30.6% . This difference reflects the strong pace of new photovoltaic projects and their growing importance within the global renewable energy expansion.
The rollout continued during May, when global solar power capacity increased by another 30.93 GW , reaching 3,056.19 GW , according to Ember's monthly data. This represents an increase of 196.18 GW since the beginning of 2016 and 477.14 GW year-on-year .
The data from April allows us to understand the gap between the two energy sources. During that month, solar power was added by 37.47 GW , while wind power added 8.21 GW . For every GW of wind power added to the global grid, approximately 4.6 GW of photovoltaic capacity were installed.

In year-on-year terms, solar power increased by 583.20 GW , equivalent to an approximate expansion of 23.9% compared to April 2025. Wind power added 167.41 GW , with a growth of close to 14.4% during the same period.
The cumulative capacity also shows that solar power is now equivalent to 2.27 times the world's wind power capacity . The speed of project implementation, the modularity of the technology, and its presence in large plants and commercial, industrial, and residential facilities explain part of this difference.

The European Union and Brazil consolidate solar dominance
The global trend was also reflected in the European Union , where the combined capacity of both sources reached 688.42 GW in April . Solar contributed 439.14 GW , compared to 249.28 GW from wind , representing approximately 63.8% of the total.
During the previous 12 months, the European Union added 68.18 GW of solar power and 13.87 GW of wind power . In April alone, solar photovoltaics added 4.51 GW , while wind capacity increased by 0.97 GW .
Growth since the beginning of the year also benefited solar technology. Between January and April, the sector added 21.86 GW of photovoltaic capacity and 4 GW of wind power , bringing the total installed capacity to 25.86 GW .

Brazil showed an even greater difference. In April, Ember recorded 93.58 GW of solar and 34.92 GW of wind power , with a combined total of 128.50 GW . Of that volume, photovoltaics accounted for approximately 72.8% .
Brazilian solar power capacity grew by 17.36 GW year-on-year , while wind power added 1.19 GW . Solar power saw an expansion of approximately 22.8% , compared to an increase of around 3.5% for wind power.
Between January and April, Brazil installed 6.50 GW of solar power , while wind power capacity barely increased by 0.05 GW . The gap continued to widen: in June, the photovoltaic capacity reported by Ember reached 94.12 GW , while wind power remained at 34.92 GW .
The values should be interpreted according to each source's methodology. While Ember presents its monthly solar and wind capacity series, the Brazilian Photovoltaic Solar Energy Association (ABSOLAR) reported 72.2 GW of operational solar capacity as of May 2026 , based on the criteria used by Brazilian government agencies.
Of that total, 49.78 GW corresponded to distributed generation and 22.51 GW to centralized plants . This source already represented 26.9% of Brazil's electricity mix and ranked second in installed capacity.
Since 2012, the sector has mobilized more than 320.4 billion reais in investments , generated more than 2.1 million jobs and avoided the emission of 115.7 million tons of carbon dioxide , according to ABSOLAR.
However, the recent expansion has slowed. Brazil added 14.5 GWp during 2025 , 23% less than the 18.9 GWp added in 2024 , and fell from fourth to fifth place among the world's largest photovoltaic markets, behind China, India, the United States, and Germany.
The association attributed this slowdown to uncompensated renewable generation cuts, restrictions on connecting distributed generation systems, the high cost of capital, currency volatility, and higher tariffs applied to photovoltaic equipment.
Bárbara Rubim, president of the Board of Directors of ABSOLAR, warned that the increase in renewable energy supply was not accompanied by equivalent investments in flexibility. “The national electricity system grew in renewable generation from solar, wind, run-of-river hydroelectric, biomass, and biogas, but without the corresponding investment in flexibility mechanisms, electricity storage, and load management,” the executive stated.
Continue reading
Rubim also contrasted Brazil's situation with Australia's deployment, the world leader in solar capacity per capita. "If we applied Australia's 1.7 kW to Brazil's 213 million inhabitants, it would be an impressive 362 GWp," he noted.
The executive emphasized that a transformation of this magnitude requires infrastructure capable of managing the system's new resources. "Transitions of scale, like Brazil's, demand compatible planning and infrastructure capable of enabling the proper management of available resources," Rubim added.
For his part, Rodrigo Sauaia, CEO of ABSOLAR, called for progress in battery remuneration, tariff modernization, and regulation of behind-the-meter storage.
“We advocate for an urgent sectoral agenda,” Sauaia stated, calling for coordination between the Ministry of Mines and Energy, the National Electric Energy Agency, and the National Electric System Operator.
The executive also proposed annual storage auctions , an immediate reduction in the tax burden on batteries, and technical mechanisms to manage electricity surpluses without affecting investments already made. 
Chile is moving forward, while Argentina maintains a different approach.
Chile also exhibited a structure dominated by solar energy. In April, it recorded 13.34 GW of photovoltaic capacity and 6.35 GW of wind power , which together totaled 19.69 GW .
Solar power accounted for approximately 67.7% of the combined capacity, more than double that of wind power. Year-on-year, both technologies showed similar growth rates: solar added 1.68 GW and wind 0.78 GW , representing increases of around 14.4% and 14% , respectively.
In May, Chile's solar capacity rose to 13.38 GW , while wind power reached 6.66 GW . The combined total reached 20.04 GW , after adding 2.75 GW over the past 12 months .

Argentina, unlike other countries, presented a different composition. In April, it registered 2.65 GW of solar power and 4.56 GW of wind power , so wind power continued to lead the renewable energy mix between the two technologies.
However, photovoltaics showed relatively faster growth. Argentina's solar capacity increased by 0.74 GW year-on-year , approximately 38.7% , while wind power added 0.22 GW , roughly 5.1% .
In May, Argentina reached 2.70 GW of solar and 4.57 GW of wind power , with a combined capacity of 7.27 GW . Although wind power still has a larger share, recent trends indicate a gradual narrowing of the gap.

The global surge in solar power occurred within a context of sustained expansion in renewable energy generation. According to data from the International Renewable Energy Agency (IRENA) , clean electricity production grew by 9.8% in 2024 , compared to 1.4% for non-renewable sources .
Renewables contributed 31.7% of global electricity generation , with a production of 9,836 TWh . Furthermore, 693 GW of new renewable capacity was added during 2025, reaching a global total of 5.2 TW .
“ The growing support for global electrification reflects the shared recognition that clean electricity strengthens energy security, resilience and competitiveness ,” said IRENA Director-General Francesco La Camera.
The agency warned that the pace is still insufficient to meet decarbonization targets by 2035. For electricity to represent 35% of final energy demand , the renewable share of generation should increase from 31.7% to 78% .
“ The technologies are available and the profitability is attractive. Now we must transition rapidly from fossil fuels to clean electricity in buildings, transport and industry ,” La Camera added.
The record photovoltaic output also coincided with a change in the economic conditions of the supply chain. China eliminated the value-added tax refund applied to solar exports starting in April 2026 , a change that could raise the price of modules by between 10% and 15% , according to shared estimates.
This scenario puts pressure on developers, manufacturers, and contractors, although for the moment it does not alter the structural trend observed by Ember. Solar power continues to add capacity at a faster rate than wind power and consolidated a lead of over 1,694 GW in April.